Beatgraphs
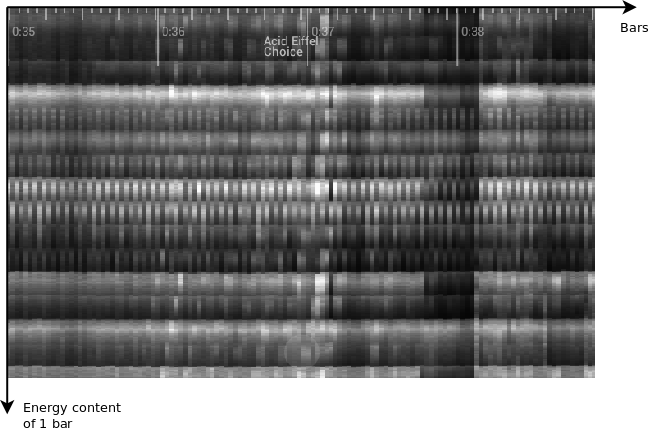
A beatgraph visualizes the energy content of a song in 2 dimensions. From top to bottom the content of one bar is shown, while, from left to right, all bars are placed next to each other. Bright pixels indicate high energy waves (typically the bass drum), while dark pixels indicate low energy.
The picture shows the pattern visualization of a simply 4/4 drum loop. Although at first it looks confusing it does show the entire song in one picture. 4 broad horizontal bands catch the eye. Each band represents a beat.
Some features of beatgraphs
- A beatgraph shows us how many beats we have per bar. In this case 4. In a 3/4 rhythm we would only see 3 beats per bar (i.e. three horizontal lines)
- A beatgraph shows the full energy content of a song, including at which positions breaks (no energy) and build ups (gradually increasing brightness) occur
- A beatgraph gives us an overall sense of the rhythm (we have a beat positioned at each 4th note) and can tell us at what position rhythm changes occur
- A beatgraph provides an overall sense of composition. E.g: a change occurs every 4, 8 or 16 bars.
- It tells us whether the rhythm spans 1 or 2 bars. In case the rhythm repeats every two bars (as opposed to every bar), one sees a distinct interleaving between the various pixel columns.
- It tells us whether the tempo is steady or floating, and if it is floating where and how.
- Lastly a beatgraph tells us the location of the first beat in a bar by always positioning the start of a bar at the top of the image.
In summary: in the blink of an eye, the DJ sees the overall structure of a song: where are the breaks ? Where are the buildups ? Where are the bass drums ? What rhythm does the song have ?
A full description of beatgraphs can be found at Beatgraphs: Music at a Glance