User Interface
Navigation
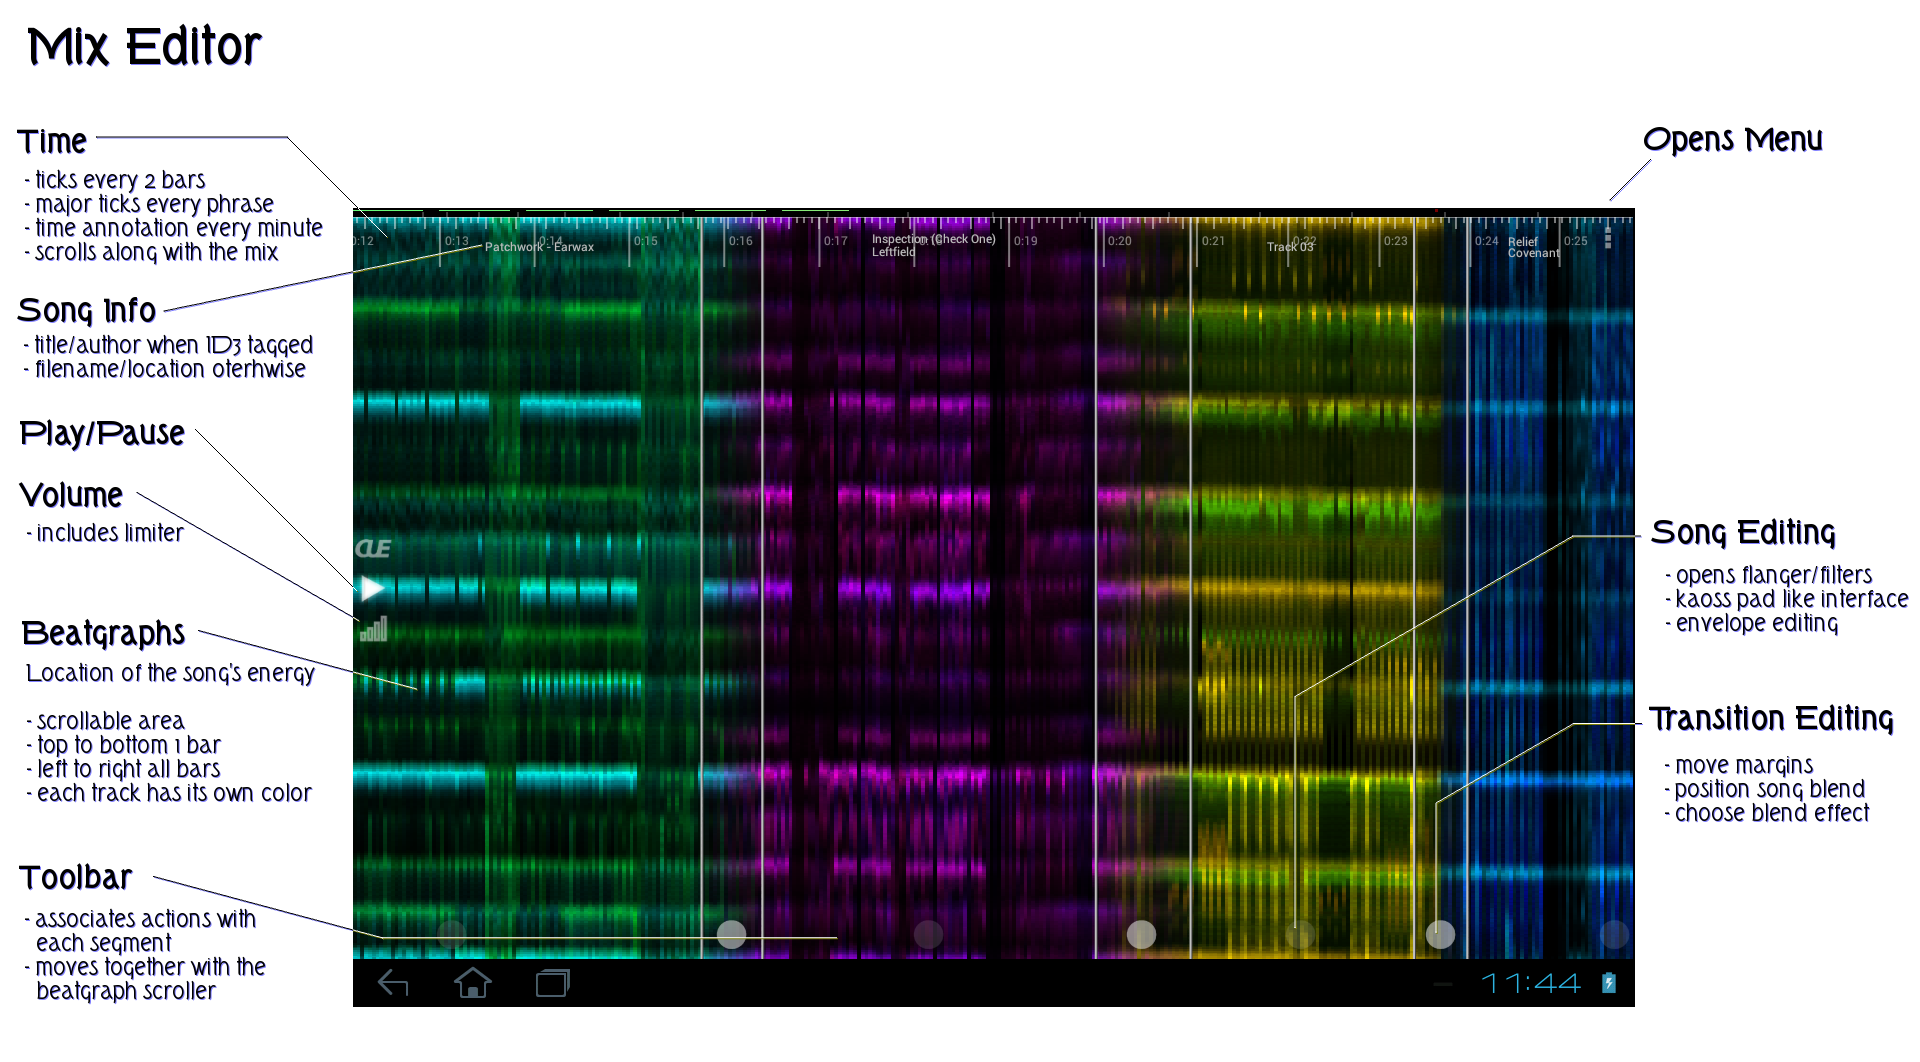
A mix consists of multiple songs sequenced together and visualized as beatgraphs. The resulting sequence is an alternation of song segments and transition segments. Segments are separated with white vertical lines. The beatgraph of each song is shown in a different color. Within a transition, the two colors blend together.
To navigate the stream, swipe the display left or right. At the top of the screen is an overview bar, which shows the entire mix from. Tapping a position in the overview bar scrolls the beatgraph overview to the specified position.
To zoom the beatgraphs, use the mousewheel.
Volume
 to play or pause the mix. In Live mode
this affects both play counters.
to play or pause the mix. In Live mode
this affects both play counters.
To change the playback volume, move the small red line in the volume bar.
Seeking

The current playposition is shown in yellow (and red if live mode is enabled). The seekbar gives information on the total playtime (in hours:minutes) and shows the song titles. When clicking the seek bar, the monitor play position (the yellow bar) will move to that position. When long clicking the seek bar, the main pointer (the red bar) will move.


 only shows low frequencies.

 only shows high frequencies.