Visually mixing Music
Workshop FON
Current DJ applications often greet the digital DJ with turntable-like controllers. We believe this to be a non-optimal use of screen real estate; and it is also an anachronism: turntables remind us of the past, they don't hint at the future. Therefore we asked ourselves the question: how can we use >1'300'000 pixels in a way that will be helpful to the next generation of DJ's ?
In this workshop we present one such an idea: beatgraphs.
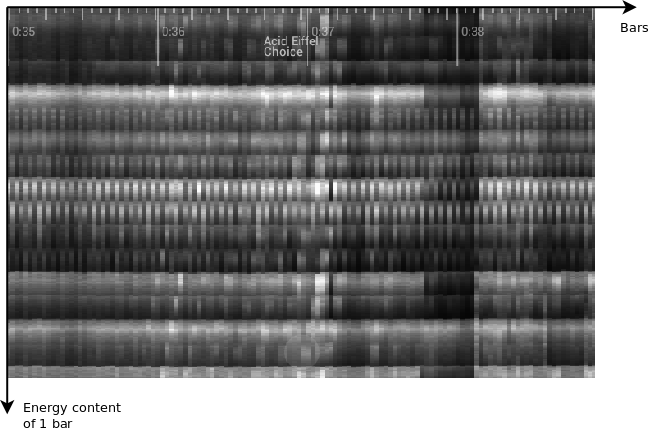
Beatgraphs (see picture above) are a method to visualize music. A beatgraph image visualizes the energy content of a song in 2 dimensions. From top to bottom the content of one bar is shown, while, from left to right, all bars are placed next to each other. Bright pixels indicate high energy waves (typically the bassdrum), while dark pixels indicate low energy.
In the blink of an eye, the DJ sees the overall structure of a song: where are the breaks ? Where are the buildups ? Where are the bassdrums ? What rhythm has the song ?
Furthermore, such beat graphs also make it possible to mix music visually.
In this workshop we
- learn how to read beatgraphs
- explain how to use them to beat-match music
- explain some mixing techniques.
- provide the visitors with hands on experience.